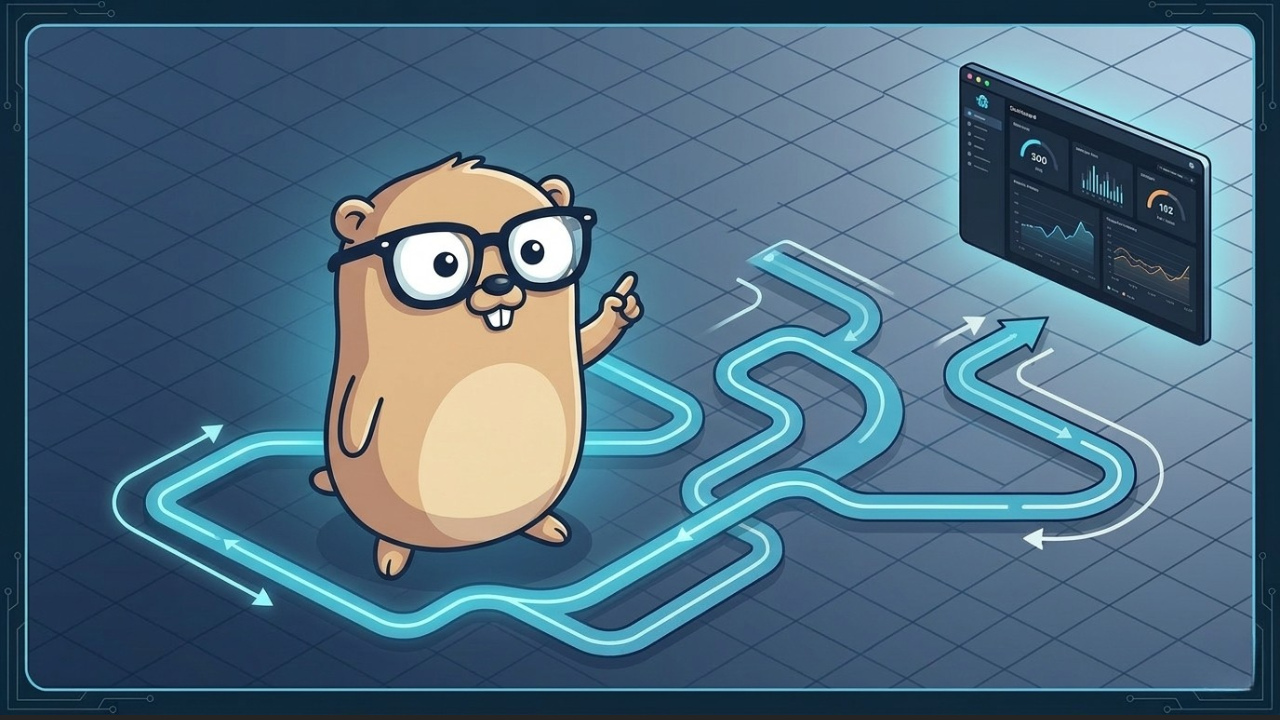
One-liner observability in Go with o11y, Last9 Agent and TraceKit
Bootstrapping observability in a fresh Go service is usually expensive in time and energy. You pick libraries, wire exporters, propagate trace context everywhere, correlate logs and metrics, set up dashboards and alerts. In practice, many teams give up halfway or keep pushing observability to later.
The idea behind one liner observability is to attack this friction. Instead of starting with a mini observability project, you add a single line of code that:
- Connects your Go service to Last9
- Collects traces, metrics and logs automatically
- Enriches errors with execution context using TraceKit
- Exposes data in the Last9 dashboard for analysis, alerts and debugging
This post walks through how that works, what the architecture looks like and a practical Go example.
1. Why one-liner observability matters
In a typical Go codebase you often see:
- An HTTP service using
net/httpor a framework likechiorgin - Calls to databases, queues and external APIs
- Errors bubbled up through layers with very little context
- Logs scattered across services without correlation to requests or users
Without integrated observability you do not really know:
- Which endpoint is degrading latency
- Which external call is causing timeouts
- How to reproduce the error you just saw in production logs
- What impact a new release had on latency percentiles
A one liner approach lowers the adoption barrier. Instead of a weeks long project, you can show value in minutes.
2. Components of the stack
The stack we will look at combines:
- Last9: observability and reliability platform that receives traces, metrics and logs and lets you create SLOs, alerts and dashboards.
- Last9 Agent: agent that receives telemetry from your Go service and forwards it to Last9.
- TraceKit: library focused on enriching errors and traces with context, stack and business metadata.
- o11y for Go: initialization layer that simplifies tracing, metrics and logging configuration into a single call.
The philosophy is simple. You initialize the stack once, in main, and the rest of the application only needs to carry the standard Go context.
3. Setting up dependencies
Assume you already have a Go service with go.mod in place. Installing the dependencies could look like this:
1
2
go get github.com/last9/o11y-go
go get github.com/last9/tracekit-go
The module names above are illustrative. Always check Last9 official documentation for current module paths and versions.
Besides Go dependencies it is common to run the Last9 Agent as a sidecar or daemon. Your application talks to the agent, and the agent talks to Last9.
4. The one liner in main
The usual pattern is to have a single observability initialization function that:
- Registers the global tracer
- Configures the exporter pointing at the Last9 Agent
- Enables runtime metrics when available
- Integrates with TraceKit and the application logger
A main.go example could look like this:
1
2
3
4
5
6
7
8
9
10
11
12
13
14
15
16
17
18
19
20
21
22
23
24
25
26
27
28
29
30
31
32
33
34
35
36
37
38
39
40
41
42
43
44
45
46
47
48
49
50
51
52
53
54
55
56
57
package main

import (
    "log"
    "net/http"
    "os"

    "github.com/last9/o11y-go"
    "github.com/last9/tracekit-go"
)

func main() {
    // One-liner observability initialization
    shutdown, err := o11y.Init(o11y.Config{
        ServiceName: os.Getenv("SERVICE_NAME"),
        Env:         os.Getenv("SERVICE_ENV"),
        AgentURL:    os.Getenv("LAST9_AGENT_URL"),
        APIKey:      os.Getenv("LAST9_API_KEY"),
    })
    if err != nil {
        log.Fatalf("failed to initialize observability: %v", err)
    }
    defer shutdown()

    mux := http.NewServeMux()
    mux.HandleFunc("/health", func(w http.ResponseWriter, r *http.Request) {
        w.WriteHeader(http.StatusOK)
        _, _ = w.Write([]byte("ok"))
    })

    mux.HandleFunc("/process", func(w http.ResponseWriter, r *http.Request) {
        ctx := r.Context()

        result, err := processOrder(ctx, r)
        if err != nil {
            terr := tracekit.Wrap(ctx, err, "failed to process order",
                tracekit.WithTag("path", r.URL.Path),
                tracekit.WithTag("method", r.Method),
            )

            o11y.Logger(ctx).Error("error while processing order", "error", terr)

            http.Error(w, "internal error", http.StatusInternalServerError)
            return
        }

        w.WriteHeader(http.StatusOK)
        _, _ = w.Write([]byte(result))
    })

    handler := o11y.HTTPMiddleware(mux)

    log.Println("server listening on :8080")
    if err := http.ListenAndServe(":8080", handler); err != nil {
        log.Fatalf("server error: %v", err)
    }
}
The one liner idea is embodied here:
1
shutdown, err := o11y.Init(o11y.Config{...})
That initialization call does the heavy lifting. It sets up tracing, metrics and logs consistently for the whole process.
Exact package and function names will depend on the real implementation, but the usage pattern tends to be close to this.
5. Wiring TraceKit at the application boundary
After initializing o11y, the next step is to connect errors to the current trace context. The tracekit.Wrap function handles that.
In the handler example the flow is:
- The request comes in and the o11y middleware creates a trace and span.
- The handler extracts
ctxfromr.Context(). - Business logic runs using that context.
- If an error occurs you call
tracekit.Wrap(ctx, err, message, tags...). - The library wraps the original error, attaches context and stack and sends it to Last9 with the trace already correlated.
In the Last9 dashboard you then see:
- The span where the error happened
- The Go stack trace
- Business metadata you added via tags, such as
tenant_id,order_idoruser_id
6. Keeping logs, metrics and traces aligned
With the HTTP middleware enabled each request generates a trace with spans that can include:
- Request reception
- Calls to instrumented dependencies such as databases and HTTP clients
- Errors enriched by TraceKit
- Latency metrics, request counters and error rates
This correlation frees the team from guessing what happened in production. Instead of looking at logs in isolation you open a single trace and see:
- The complete request timeline
- Services and dependencies involved
- The slowest segments
- Errors and timeouts with full context
7. Trace driven debugging workflow
In practice this changes how your team works on incidents.
Before the stack is configured the workflow often looks like this:
- Someone spots a vague error in a log stream
- A hunt for request IDs across multiple services starts
- Nobody is sure whether all customers are affected or only one tenant
With the one liner in production the workflow becomes:
- You search for the error in the Last9 dashboard
- You open a trace with the error annotated by TraceKit
- You see the impacted user or tenant, the calling service, the dependency chain and where validation failed or a timeout occurred
This model reduces incident analysis time and leads to much more concrete discussions.
8. Recommended usage patterns
A few patterns help you extract more value from this approach:
Centralized initialization in
main
Configure o11y once. Avoid scattered initialization code across packages.Environment variables required in production
IfLAST9_API_KEYorLAST9_AGENT_URLare empty in production, fail fast instead of running without observability.Consistent use of context
Always passctxthrough internal calls. That is where trace, span, logger and metadata live.Wrap errors at important boundaries
Use TraceKit when an error crosses a boundary, such as use case layers or external communication.Standardized business tags
Define a small, consistent set of business tags for every service, such astenant_id,request_idandservice.
9. Practical benefits
Adopting a one-liner observability model in Go provides quick wins:
- Easier adoption, since the initial code change surface is small.
- Less plumbing code to maintain, because the stack encapsulates tracing, metrics and logging configuration.
- Correlation between logs, errors and traces by default, without manual effort.
- A straightforward way to demonstrate value to engineering and management within the first hours.
Instead of being a never ending project, observability becomes a trivial decision you make when starting the service.
10. Final thoughts
One-liner observability in Go with o11y, Last9 Agent and TraceKit is not magic. It is about packaging solid observability practices into a simple initialization step. By centralizing configuration in a single call and integrating tracing, metrics, logs and enriched errors automatically, you move observability from a future project into an initialization pattern.
If your team has postponed instrumentation more than once this is a good starting point. Add the initialization line, deploy the service, look at the traces in Last9 and then deepen instrumentation where it makes the most sense.